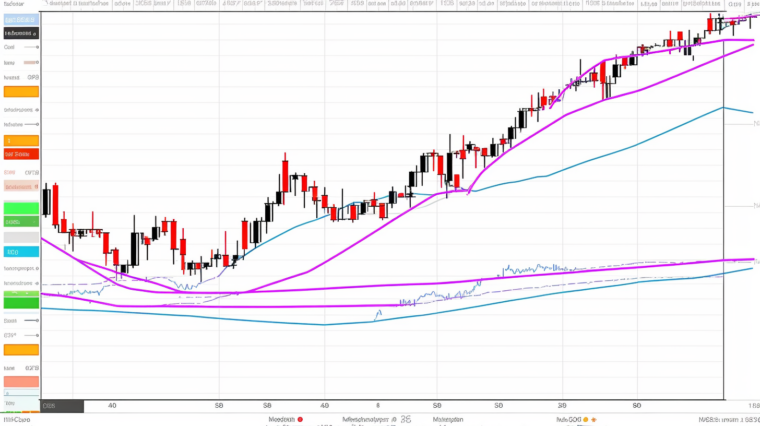
As the week draws to a close, we observe a state of equilibrium in the Bitcoin market, with neither buyers nor sellers asserting dominance. The leading cryptocurrency, according to CoinMarketCap, has experienced a marginal decline of 0.12% in the past 24 hours.
Examining the Hourly Bitcoin Chart
Our Bitcoin price analysis starts with the hourly chart, which indicates a bearish trend. The Bitcoin price appears to be reverting to its recently established support level of $29,351. If the buying side fails to gain momentum, we might witness a drop to the $29,300 zone in the forthcoming day.
A Closer Look at the Daily Time Frame
Turning our attention to the daily time frame, we see a similar narrative. However, the key level for traders to monitor here is $29,294. If the price closes beneath this level, we could expect the ongoing downward trend to test the $29,000 range shortly.
Weekly Chart: A State of Equilibrium
When we extend our Bitcoin price analysis to the weekly chart, we find neither a bullish nor a bearish trend. The price is distant from the principal levels, suggesting the most probable outcome to be sideways trading within the $29,000-$30,000 bracket till the month’s end.
At the time of writing, Bitcoin is trading at $29,359.
For those interested in keeping an eye on these trends, applications like cryptoview.io can be a valuable resource. This platform provides a comprehensive and intuitive interface for tracking and analyzing crypto market trends.


