Deciphering the future trajectory of Bitcoin’s value can be a challenging task. However, by closely observing the cryptocurrency’s hourly chart, we can identify certain patterns and critical levels of support and resistance that may shed light on potential future movements. This analysis forms the basis of our Bitcoin Price Forecast.
Understanding the Key Levels in Bitcoin’s Hourly Movement
Currently, Bitcoin’s hourly chart suggests a sideways trend, indicating that the levels of support and resistance are of paramount importance. These levels serve as a barometer for trading strategies, as they provide insights into the potential direction of the cryptocurrency’s value. If Bitcoin can successfully break through the resistance level, it could pave the way for an upward trajectory. However, the presence of significant selling pressure within the altcoin market underscores the importance of vigilance when monitoring these resistance zones.
Medium-Term Outlook for Bitcoin
When assessing Bitcoin’s daily technical chart, it appears to be maintaining a sideways movement above the support level of $25,800. As long as Bitcoin continues to close daily above this level, there’s potential for an upward climb to the $26,940 level. A daily closure above this level could set the stage for a further rise to the $28,000 mark. However, failure to breach these resistance levels could potentially trigger a downward trend. If Bitcoin closes below the $25,800 support, it could trigger a further drop to $25,200, and possibly even to $24,800. Consequently, it’s crucial for Bitcoin to maintain its upward trend by consistently closing above the $25,800 mark.
Short-Term Predictions for Bitcoin
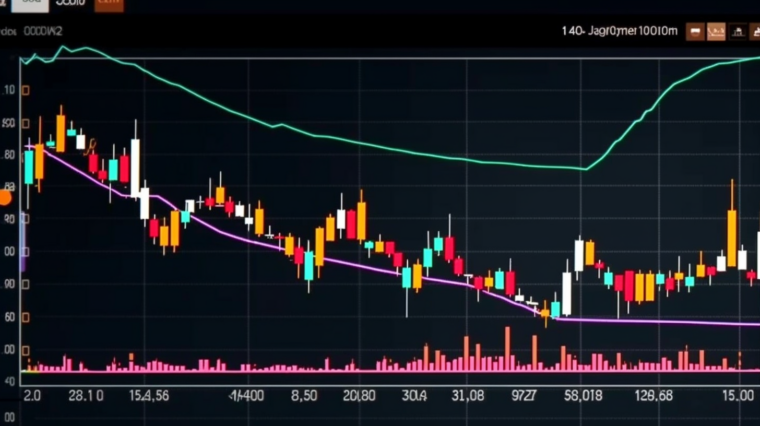
Looking at Bitcoin’s hourly technical chart, it’s clear that the cryptocurrency is currently moving sideways below the yellow resistance box and above the purple support line. If Bitcoin manages to close hourly above the yellow box, it could potentially rise to the $26,600 level. However, if it closes below the purple support at $25,800, the downward trend could extend to $25,200. These two critical levels should be closely monitored by Bitcoin investors as they develop their trading strategies. Given the intense selling pressure in altcoins driven by Bitcoin’s downward movement, it may be advisable for those holding long positions to wait until Bitcoin surpasses its resistance zones.
For those interested in monitoring these movements and making informed trading decisions, cryptoview.io provides a comprehensive platform to track and analyze the cryptocurrency market. Explore cryptoview.io now


