Is the price of Ethereum on the brink of a breakthrough? This is a question that many investors and traders are asking themselves as they observe the current market trends. The focus of this ethereum price analysis is to shed light on the recent price movements and what they could potentially mean for the future.
Understanding Ethereum’s Current Stand
Ethereum has recently seen a resurgence in price, with the value bouncing back and presently testing a crucial point. If this bullish momentum continues, it is plausible that the price might approach the $2,000 resistance zone in the not-so-distant future.
On the daily timeframe, the $1,550 support level has once again demonstrated its significance by keeping the price from plummeting towards the $1,400 area. Ethereum is currently testing the 50-day moving average around $1,600. Should Ethereum break through this barrier, the next targets are likely to be the $1,750 resistance level and the 200-day moving average located close to the $1,800 mark.
Another point of interest is the RSI indicator, which has climbed above the 50% mark, suggesting that the momentum is shifting in favor of the buyers.
A Closer Look at the Short-term Price Movements
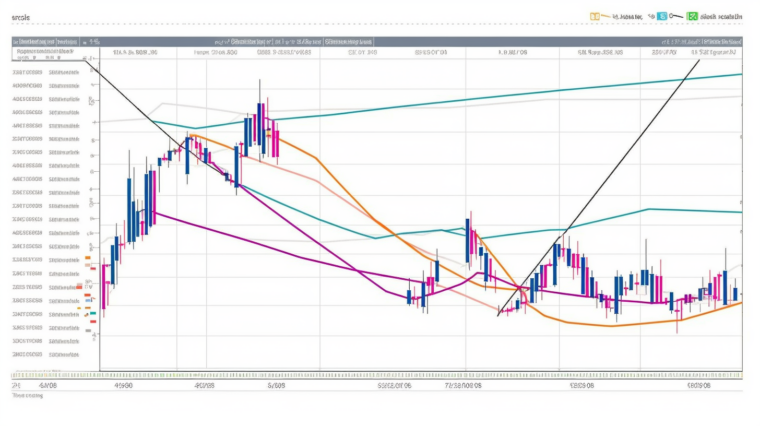
Upon examining the 4-hour chart, it becomes clear that the price has been oscillating between the $1,550 and $1,750 levels for some time now. The market has recently rebounded from the $1,550 level and is currently testing the $1,600 resistance zone.
A bullish breakout from this zone could set the stage for a further rally towards $1,750 in the upcoming weeks. However, it is crucial for investors to monitor the RSI indicator as it is approaching the overbought territory once again, which could lead to a rejection from the $1,600 zone.
On-Chain Analysis and What It Suggests
Ethereum’s price has recently displayed an upward trajectory after months of consolidation and slow descent. This has left investors questioning whether a new bullish phase is imminent or if lower prices are still on the cards.
The taker buy-sell ratio metric, a crucial futures market sentiment indicator, has shown an increase but is still below 1. If this uptrend in the taker buy-sell ratio continues and the metric surpasses 1, a new price rally could be on the horizon, and the market could finally overcome the $2,000 resistance level.
However, if the metric fails to exceed 1, the status quo is likely to remain, and the price could experience a further drop in the short term.
In conclusion, while the future of Ethereum’s price remains uncertain, tools like cryptoview.io can help investors make informed decisions by providing them with detailed and up-to-date market data.


