As Bitcoin (BTC) made its way past the significant $30,000 milestone, a notable uptick in profit-taking was observed, hitting a three-week peak. Interestingly, the surge in profit-taking seemed to correlate inversely with the rising price of BTC, suggesting a stronger negative flow. This phenomenon has been a recurring theme in recent months, with the $30,000 mark acting as a psychological threshold for the cryptocurrency.
Understanding the Bitcoin Profit-Taking Surge
A closer analysis of the data from Santiment reveals that the recent Bitcoin profit-taking surge has been predominantly driven by long-term holders. This surge marked the highest level of profit-taking seen in almost a month. One of the key indicators providing insights into this behavior is the Market Value to Realized Value (MVRV) ratio. As it stands, the intensity of profit-taking appears to have eased off, causing a decline in the ratio of daily on-chain transaction volume in profit to loss to about 1.5%.
Decoding the MVRV Ratios
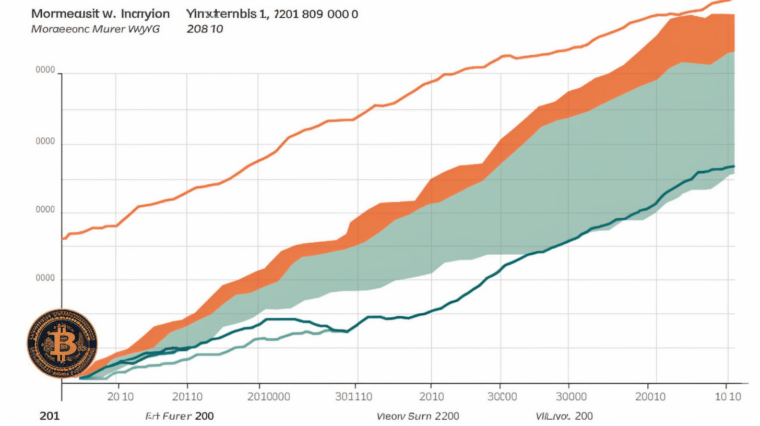
By comparing the Bitcoin MVRV across various timeframes – 30, 60, 90, and 180 days – we can understand why long-term holders were particularly eager to cash in on the price surge. The 30-day MVRV data from Santiment suggests that the rise in BTC price resulted in less than a 1% increase. At the time of writing, the 30-day MVRV was around 0.3%, meaning that sales from these holders would yield a mere 0.3% profit. The 60-day MVRV, however, tells a different story. Holders within this timeframe were able to secure more substantial profits, with the MVRV around 2%, implying a potential profit of 2% for those selling within this period.
Delving further into the 90-day MVRV reveals an increase of over 1% compared to the 60-day MVRV. At the time of writing, the 90-day MVRV was above 3.7%. And the 180-day MVRV paints an even more enticing picture for long-term holders, indicating that they were the main beneficiaries of the recent surge in Bitcoin’s price. The 180-day MVRV was over 6%, suggesting that these holders could have been among those who capitalized on the opportunity to profit when the BTC price broke the $30,000 barrier.
Examining Bitcoin Flow in Exchanges
Contrary to the profit-taking trend indicated by the Santiment chart, the exchange flow metric from Glassnode reveals a different pattern. The data for August 8 shows a greater outflow of Bitcoin from exchanges compared to its inflow. This significant outflow suggests that a larger volume of Bitcoin was being withdrawn from exchange platforms, indicating that many holders preferred to transfer their Bitcoin holdings away from exchanges rather than selling them immediately, despite the price increase.
As we continue to monitor the ebbs and flows of Bitcoin, one useful tool for staying informed is cryptoview.io. This platform offers a comprehensive overview of the cryptocurrency market, helping users make informed decisions.
Even though BTC’s value continues to hover above the $30,000 mark, a slight downward trend is becoming evident. Yet, the recent Bitcoin profit-taking surge underscores the dynamic nature of the cryptocurrency market, demonstrating how different holders respond to price changes in diverse ways.


