Could the recent bullish pattern in Solana’s market structure signify an increase in demand? This question is one that many investors and traders have been pondering, especially with the recent influx of buyers over the past few days. Let’s delve into the details to provide a clearer picture.
Understanding Solana’s Market Structure
With the price of Solana [SOL] experiencing a rally from $22.6 on August 7th to $24.8 at present, the potential for further gains seems promising. However, a substantial hurdle lies in the $25.5-$25.7 range. The likelihood of SOL breaching this resistance is high, especially if Bitcoin [BTC] maintains its price above $29.2k.
From a broader timeframe perspective, Solana has remained steadfastly bullish. Its robust rebound from just above the $22 mark indicates a strong presence of eager buyers.
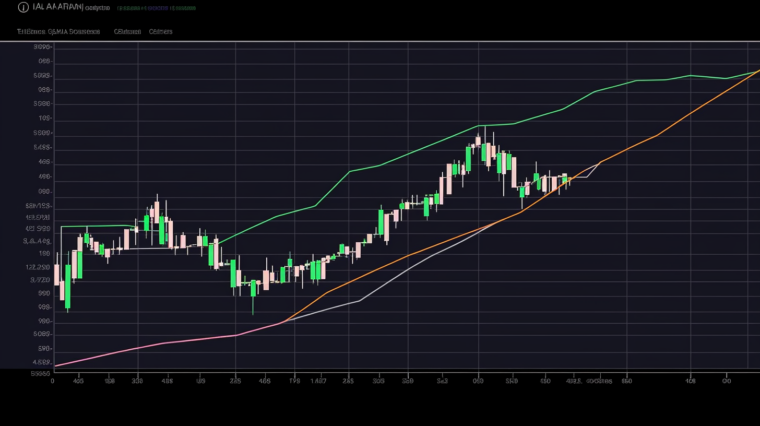
Analysing the Ascending Triangle Pattern
The recent price action has given rise to an ascending triangle pattern, combined with the bullish structure, suggesting that buyers are in a strong position. This pattern, coupled with the bullish structure, signals a potential move towards the north. The On Balance Volume (OBV) indicator appears to be skyrocketing, which underscores substantial demand and reinforces the prospect of further gains for SOL.
However, it’s crucial to note that while an upward breakout is anticipated, a bearish move should not be entirely ruled out. But, the current evidence seems to lean more towards the bulls.
Spotting Bullish Sentiment
The speculator sentiment, based on the Open Interest chart, is bullish. In the past two days, both the price and the Open Interest have been on an upward trajectory, indicating that bulls are entering the market in anticipation of further gains. The spot CVD has also been trending upwards, and the funding rate remains positive, further suggesting a short-term bullish sentiment.
However, should SOL drop below $24.15, the market structure could shift to bearish, invalidating the bullish pattern. To the north, the local high at $25.68 remains a valid target. Additionally, there is a bearish order block around the $26-region from July 21, indicating that Solana bulls might not break out past this zone on their first attempt.
Are you curious about how your portfolio is performing? The Solana Profit Calculator, a feature of the cryptoview.io application, might be able to provide some insights. The application offers a comprehensive overview of your crypto investments, helping you make informed decisions.


