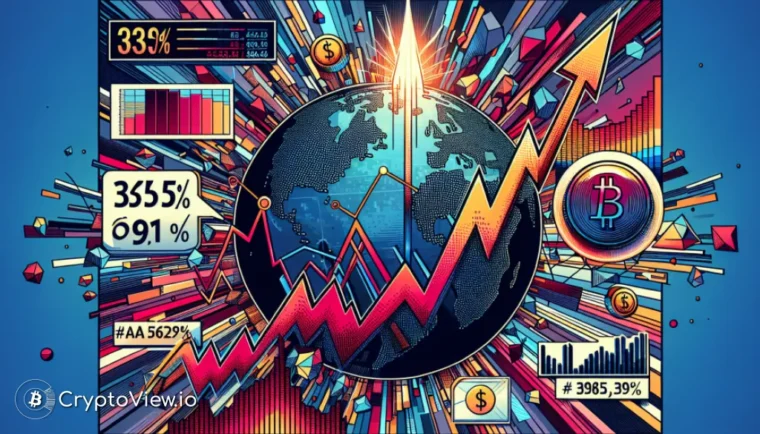
Virtuals Protocol (VIRTUAL) recently saw a remarkable 33.5% price surge, pushing its value past the $1 mark, accompanied by a staggering 391% spike in trading volume. This significant upward movement has reignited discussions around its future, making a thorough Virtuals Protocol price analysis essential for investors navigating the current market dynamics.
Price of Virtuals Protocol (VIRTUAL)
Unpacking VIRTUAL’s Recent Price Action
The cryptocurrency market has been a rollercoaster, yet Virtuals Protocol managed to capture attention with a notable 33.5% increase in its token price over a 24-hour period. This rally propelled VIRTUAL above the crucial $1 threshold, a psychological level often watched by traders. What fueled this ascent? A dramatic 391% surge in daily trading volume certainly played a pivotal role, indicating a significant influx of market interest and liquidity. While the broader crypto landscape was grappling with lingering fear following a major liquidation event that occurred on October 10, 2025, VIRTUAL’s performance offered a glimmer of optimism. However, despite the impressive short-term gains, the market buzz suggests a cautious sentiment, with many questioning the sustainability of this upward trajectory given persistent bearish technical signals.
On-Chain Signals: A Deeper Dive into Holder Behavior
Looking beyond price charts, on-chain metrics offer valuable insights into the underlying health and investor sentiment surrounding Virtuals Protocol. Data from leading blockchain analytics platforms revealed that the Mean Coin Age for VIRTUAL had been on a steady upward trend since late August 2025. This metric is a strong indicator of holder confidence, suggesting that investors were retaining their tokens for longer periods, even as prices experienced fluctuations. This trend pointed towards a strong conviction among the project’s ‘diamond hands,’ hinting at an accumulation phase rather than widespread selling, despite minor disruptions observed in early October 2025.
However, the picture isn’t entirely clear-cut. A sharp increase in dormant circulation was also noted over the two weeks leading up to October 25, 2025. This indicated that some long-term holders were offloading portions of their positions, likely reacting to market uncertainties and contributing to temporary price stutters. Furthermore, while daily active addresses and network growth saw a positive uptick around October 24, 2025, aligning with the price push above $1, these metrics had not yet reached the higher levels seen earlier in the year, such as in May or January 2025. For Virtuals Protocol to truly build robust bullish conviction and achieve long-term adoption, a sustained increase in user engagement and network expansion will be crucial in the coming months.
Technical Hurdles and Key Resistance Levels
A closer examination of VIRTUAL’s 1-day chart reveals a predominantly bearish momentum, even amidst its recent recovery. While the MACD line showed early signs of turning upward and the Accumulation/Distribution (A/D) indicator reached new local highs—bolstered by the recent volume surge—these positive signals are navigating a challenging technical landscape. The token’s rally pushed it directly into a significant supply zone around the $1 mark, a level that previously acted as strong support from late August 2025 until it was breached during the broader market sell-off. Reclaiming this zone convincingly requires substantial buying pressure.
Key resistance levels are now firmly established at $1.2 and $1.26. For bulls to genuinely regain control and pave the way for further upside, high-volume breaks above these thresholds are essential. Without such decisive movements, the rally risks being a liquidity grab, potentially leading to renewed downward pressure. Traders and investors conducting a comprehensive Virtuals Protocol price analysis should remain vigilant, especially for market movements over the weekend, which often see increased volatility. The protocol’s focus on decentralized virtual asset creation adds a fundamental layer to this technical assessment, underscoring the importance of monitoring both market action and core project developments.
Trend of Virtuals Protocol (VIRTUAL)
What’s Next for Virtuals Protocol?
Virtuals Protocol’s recent surge, driven by impressive trading volume and underlying on-chain accumulation, has certainly injected a dose of optimism into its community. Yet, the mixed signals from network growth and the formidable technical resistance levels at $1.2 and $1.26 suggest that a sustained recovery might face significant headwinds. The broader cryptocurrency market’s sentiment will undoubtedly play a critical role in VIRTUAL’s trajectory, as fear and uncertainty can quickly dampen individual token rallies.
For those looking to stay ahead, monitoring VIRTUAL’s network expansion, developer activity, and overall market sentiment is key. Tools like cryptoview.io can provide invaluable real-time data and analytics to help investors make informed decisions. A thorough Virtuals Protocol price analysis must always balance technical indicators with fundamental growth and market context. As the project continues to evolve in the dynamic virtual assets space, vigilance and a well-rounded approach will be paramount for navigating potential opportunities and risks.
Find opportunities with CryptoView.io

