Shiba Inu saw a 17.25% surge in trading volume to $221.76 million, yet its price dipped below the $0.00001223 support. This, combined with a plummeting burn rate, has traders eyeing the shiba inu death cross. What does this mean for SHIB’s short-term price action?
Price of Shiba Inu (SHIB)
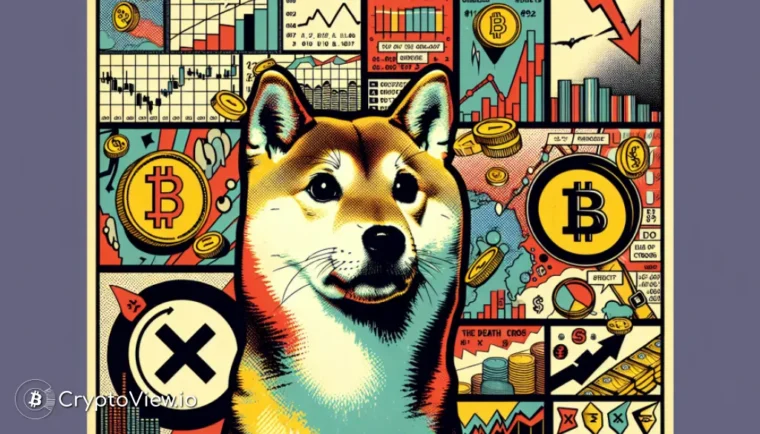
Decoding the Shiba Inu Death Cross
A shiba inu death cross occurs when a short-term moving average (like the 9-day MA) dips below a longer-term one (like the 26-day MA). This pattern often signals a shift from bullish to bearish momentum, potentially foreshadowing further price declines. While not a guaranteed predictor, it’s a red flag that traders watch closely, especially alongside other indicators.
For Shiba Inu, this crossover happened on the three-hour chart, suggesting a potential short-term downturn. Savvy traders use tools like cryptoview.io to track these patterns and gain an edge in the market. Diamond hands might HODL, but day traders could be looking for quick exits.
SHIB Price and the Death Cross: What to Expect
Death crosses often trigger increased selling pressure. This can lead to a cascade effect, driving the price further down until a significant support level is reached or buying volume picks up. In SHIB’s case, the $0.00001223 support has already been breached, adding to the bearish sentiment. The next few days will be crucial in determining if SHIB can bounce back or if the bears will continue to dominate.
Trend of Shiba Inu (SHIB)
The Burn Rate Plunge: Adding Fuel to the Fire
The drastic 98% drop in SHIB’s burn rate to a mere 223,914 tokens in 24 hours adds another layer of concern. A lower burn rate means a slower reduction in circulating supply, which can put downward pressure on the price. This development, coupled with the shiba inu death cross, makes the current market outlook for SHIB rather precarious. Keep a close watch on burn rate metrics; a sustained recovery in burning activity could signal a potential price reversal.
Find insights on CryptoView.io

