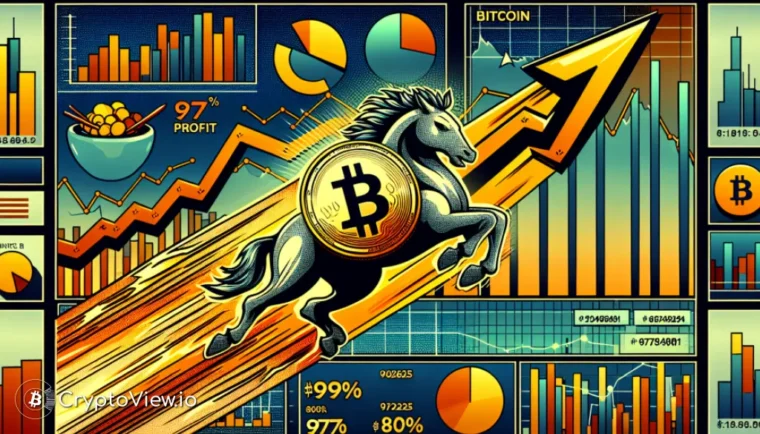
With 97% of Bitcoin’s supply currently in profit, on-chain metrics suggest the asset’s upward trajectory still has significant momentum, providing a nuanced perspective for any comprehensive Bitcoin bull run analysis. While the market shows signs of exuberance, historical data and shifting ownership patterns indicate that the current rally might have more room to run before a definitive top.
Price of Bitcoin (BTC)
Decoding Market Sentiment: The NUPL Indicator
The Net Unrealized Profit/Loss (NUPL) metric, a key on-chain indicator, recently registered at +0.52. Historically, this level often marks a pivotal transition point, moving from a phase of cautious optimism into full-blown market euphoria. Previous cycles, notably in 2017 and 2021, saw similar NUPL readings precede significant price rallies, signaling peak bullish sentiment before eventual market corrections.
While a high percentage of supply in profit, like the current 97%, underscores strong investor confidence, it also suggests a crowded market. Sustained upward movement might necessitate periods of consolidation to ensure the rally remains healthy and prevents an overheated market prone to sharp pullbacks. Monitoring this metric is crucial for understanding the prevailing market psychology.
The Shifting Landscape of Ownership: New Whales Emerge
A notable trend in the current market cycle is the increasing influence of short-term holders (STHs), who now account for a record 44% of Bitcoin’s Realized Cap. This phenomenon points to long-term holders (LTHs) strategically taking profits, while a fresh wave of market entrants, often with substantial capital, steps in to absorb the supply. This dynamic shift in ownership is typically observed during the latter stages of a bull run.
However, the present situation appears to be different. Significant inflows into spot Bitcoin ETFs, coupled with robust stablecoin liquidity and sustained institutional buying, are effectively absorbing the selling pressure. This creates a more resilient form of market euphoria, potentially extending the rally beyond traditional expectations. A future decline in STH dominance could usher in a new phase of long-term accumulation, further solidifying Bitcoin’s price floor.
Deep Dive into Bitcoin Bull Run Analysis: Funding Rates as a Contrarian Signal
One of the most compelling signals for predicting Bitcoin’s short-term price movements comes from Binance’s Funding Rates. Historically, periods where funding rates turned negative often preceded strong Bitcoin rebounds. Negative funding rates typically indicate that the majority of traders are bearish, paying a premium to short Bitcoin, which creates ripe conditions for a contrarian rally or a ‘short squeeze’.
Retrospectively, this pattern proved accurate in several instances. In October 2023, negative funding rates were followed by a substantial surge in BTC’s price, moving from approximately $28,000 to $73,000. Similarly, in September 2024, the asset saw a climb from $57,000 to $108,000 after funding rates dipped. Most recently, in April 2025, a similar dip in funding rates preceded a rally from $95,000 to $123,000. With funding rates showing signs of dipping again and prices stabilizing around $115,000 as of October 15, 2025, the market buzz suggests another significant move could be on the horizon, potentially catching bears off guard.
Trend of Bitcoin (BTC)
Navigating the Current Landscape and Future Outlook
The confluence of these on-chain metrics and market dynamics paints a complex yet intriguing picture for Bitcoin. While the high percentage of supply in profit suggests a mature phase of the bull run, the influx of new capital from STHs and institutions, alongside the predictive power of negative funding rates, points to continued potential for growth. Investors are currently weighing the possibility of a final, powerful leg up versus the need for a healthy market correction.
Understanding these intricate market signals is vital for making informed decisions. Platforms like cryptoview.io offer valuable tools for tracking such on-chain data and market sentiment, helping you stay ahead in this fast-paced environment. Keeping an eye on these indicators can help you discern whether it’s time to *HODL* or prepare for potential volatility. For those looking to capitalize on market movements, having a comprehensive view of the ecosystem is paramount.


