Despite a minor 0.17% dip in the global cryptocurrency market cap over the last day, the chart patterns look promising for MATIC, MANA, and GMT. These cryptocurrencies have been displaying promising patterns, hinting at a potential upswing. The overall market valuation stands at approximately $1.04 trillion, presenting potential discounted purchase opportunities for traders.
Examining MATIC’s Market Performance
Caught in a medium-term negative price channel, MATIC has some ground to cover to break free from its bearish trend. However, traders are working hard to push this cryptocurrency out of its descending trajectory. Currently, MATIC is trading at the upper echelon of the present price channel. If it ends the trading day above the $0.4970 support level, it could signify the beginning of a breakout from its ongoing bearish trend.
Should this occur, the potential for MATIC to continue its ascent and turn the $0.5500 resistance level into support is high. Subsequently, sustained buying support could further boost the Layer-2 cryptocurrency’s price to the next barrier at $0.6500. However, a dip below the $0.4970 support level in the next two days could invalidate this bullish outlook.
Assessing GMT’s Prospects
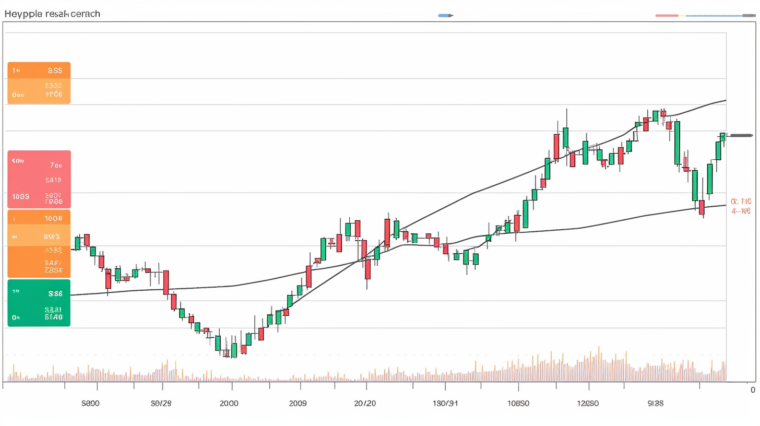
On GMT’s chart, a breakout pattern has been taking shape over the past fortnight, suggesting a potent short-term move. At the moment, the 9-day EMA line is attempting to cross above the 20-day EMA line, implying a shift in short-term momentum towards the bulls. If this technical flag is confirmed, GMT’s price could break past the $0.1650 resistance level and possibly challenge the next barrier at $0.1990.
Contrarily, if the daily RSI line crosses bearishly below the RSI SMA line, it could indicate a shift in power to the sellers, potentially leading to a price drop.
Understanding MANA’s Market Movements
Similar to GMT, MANA’s daily RSI line is on the verge of crossing below the daily RSI SMA line. The equal positioning of the 9-day EMA and 20-day EMA lines suggests that traders are awaiting a signal for MANA’s price direction. A bearish short-term trend could be confirmed if the daily RSI line crosses below the daily RSI SMA line, possibly leading to a price drop to the immediate support level at $0.2630.
Conversely, if the bulls manage to prevent the daily RSI line from crossing below the daily RSI SMA line, it could lead to a positive shift in MANA’s short-term trend, potentially pushing the altcoin to overcome the $0.3210 threshold in the following days.
While it’s crucial to stay updated on these market movements, a tool like cryptoview.io can be immensely helpful in tracking these changes. It can provide a comprehensive overview of the market, allowing you to make informed decisions.
Note: This analysis is shared in good faith for informational purposes only. It is advised that readers carry out their own research and exercise due diligence before taking any action. Neither the writer nor their affiliates will be held responsible for any consequences, direct or indirect, arising from any action taken based on this analysis.


