Is a resurgence on the horizon for Solana [SOL]? Despite recent market trends leaning towards the bearish, the confluence of the Fibonacci level and the bullish breaker could be a key indicator to watch. However, this isn’t a surefire sign of a Solana recovery, especially given the recent display of bull weakness.
Understanding the Recent Market Activity
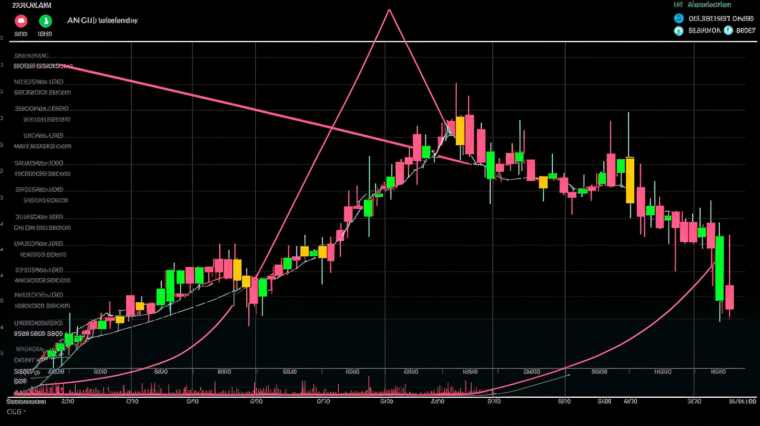
From late July, the SOL market has exhibited a bearish trend. Bulls struggled to push past the $25 resistance, resulting in a tumble below the $22.5 mark over the past week. The trading value of SOL, whether it be 1, 10, or 100, is currently in a precarious position.
The SOL bulls found themselves at a higher timeframe area of interest. If they hoped to drive prices up, maintaining above the $20 psychological level was crucial. Yet, market indicators pointed to a stronger seller presence at the time of writing.
The Breaker Block and Fibonacci Level
The bullish breaker block within the $20.1-$22.2 range, as seen in the 1-week timeframe price chart, could serve as a turning point for SOL sentiment. This block had initially served as resistance in early June, but was flipped to support during the July rally. At present, Solana is trading within this area, and the $20 psychological level is within reach.
However, the 1-day chart market structure remains bearish. SOL established a lower high at $25.68 and a lower low at $22.23 on August 5th, indicating a developing downtrend over the following two weeks.
Market Indicators and Sentiment
The Relative Strength Index (RSI) indicates bearish momentum over the past week, and the On-Balance Volume (OBV) has been forming lower highs since mid-July, signalling a decrease in SOL demand. This isn’t a positive sign for a potential recovery. The moving averages are teetering on the edge of signaling a downtrend, while falling trading volume and Open Interest further reinforce the bearish sentiment.
On a positive note, the funding rate has risen above 0 in recent hours, after being negative for several days. While this doesn’t necessarily indicate a shift in sentiment, it suggests that bulls might have a chance at halting the downtrend.
Open Interest data, however, suggests that bearish sentiment still dominates the market. The significant drop in OI over the past ten days has not reversed the downtrend, even though SOL is at long-term support. As such, a drop below the $20 support cannot be entirely ruled out. If SOL can climb back above $22.5 and retest it as support, a recovery becomes more plausible.
To keep track of these market trends and make informed decisions, tools like cryptoview.io can be incredibly useful. By providing real-time data and comprehensive market analysis, it can help users stay ahead of the curve.


