Litecoin, following its halving event, has seen considerable volatility in its value, with a sharp decline below critical support levels. Many were expecting a bullish rebound for LTC from these low points, but a strong buying momentum was missing. Nevertheless, current on-chain metrics suggest that whale investors might be silently making their move, potentially anticipating a strong bullish rally in the near future.
Litecoin’s Large Transaction Volume: An Indicator of Renewed Interest?
Litecoin (LTC) has been drawing attention with its consistently growing transaction volume, indicating a resurgence of interest among traders. Data from IntoTheBlock shows that Litecoin’s large transaction volume has seen an uptick over the past week, moving from $1.74 billion to $1.84 billion. This could be a sign of whale investors entering the LTC market during the current dip.
A steady increase in volume is often a precursor to a bullish trend, signaling robust demand and positive sentiment among traders and investors. Furthermore, it can lead to significant short-liquidation if the LTC price experiences a bullish surge due to buying pressure.
Miner Behavior: A Potential Catalyst for Bullish Momentum?
Another factor that could potentially fuel Litecoin’s bullish momentum is the recent behavior of its miners. Data suggests a noticeable change in miners’ actions, especially in their selling habits. Over the last two weeks, there’s been a significant decrease in the outflow from Litecoin miners. This metric, which gauges the amount of Litecoin being transferred out of miners’ wallets, has seen a substantial drop, moving from a high of $28 million to a much lower $13.7 million.
With miners selling fewer Litecoins, there could be a potential tightening of the coin’s supply in the market. A decrease in supply, when coupled with steady or increasing demand, can apply upward pressure on the price.
What’s the Future for LTC Price?
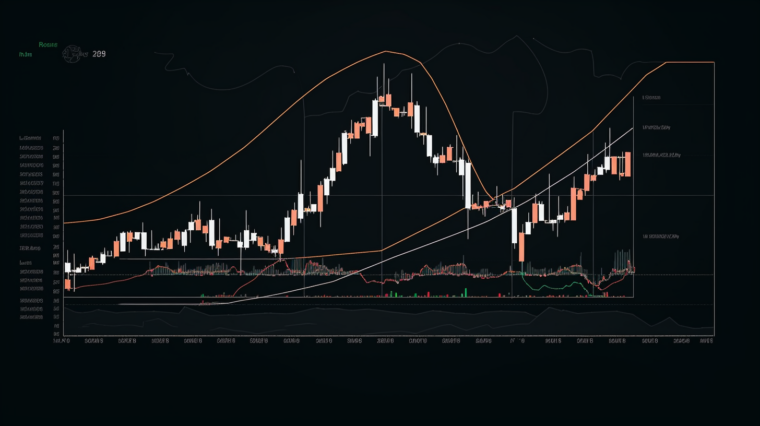
Litecoin is struggling to rebound from the strong support level of $80, indicating a lack of buying pressure near higher levels of $85. The declining 20-day EMA at $82.8 on the 4-hour price chart, along with the RSI below the midline, suggests that bears currently have the upper hand. If the LTC price slips and fails to maintain above $80, it could indicate a strong downward correction. In such a case, the next support levels to watch are $74 and $65.
On the other hand, the primary resistance to watch on the upward journey is $85, which is the upper limit of the consolidation zone. If buyers manage to push the price above $88, it could signify the start of a more significant recovery, potentially hitting $97. However, this price point might witness increased selling pressure.
For those interested in tracking these developments in the Litecoin market, the cryptoview.io application provides an easy and efficient way to monitor these trends.
Discover More With cryptoview.io
It’s worth noting that past performance suggests a ray of hope for bulls. After the 2019 Litecoin halving, LTC soared to $400 in 2021, despite a drop from $66 to $35 in December 2019. As such, the current bearish post-halving trend might not be a definitive indicator of the coin’s future trajectory.


