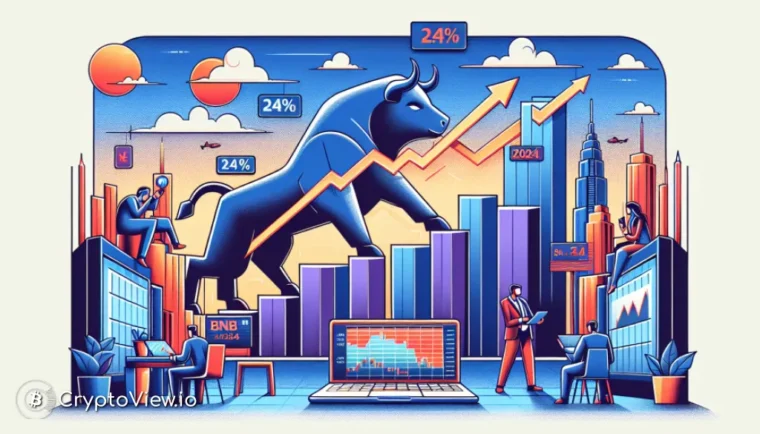
In late 2024, as Bitcoin approached its then all-time high, BNB demonstrated significant bullish momentum, rising 24% in a single month. This surge fueled considerable market excitement, with many traders discussing a potential BNB price prediction $2000. Technical indicators at the time suggested a robust uptrend, prompting discussions about a potential “moonshot” scenario for the token.
Price of BNB (BNB)
Unpacking BNB’s Bullish Signals of Late 2024
During the latter part of 2024, BNB, formerly Binance Coin, caught the eye of many market participants. It wasn’t just Bitcoin making headlines; BNB posted a remarkable 24% gain in a single month, with daily closes often showing solid increases, such as one instance recording a 6.06% daily surge after hitting a new all-time high of $1,168.39. Bulls appeared to be firmly in control, effortlessly breaching established resistance levels.
Adding substantial weight to this rally, Kazakhstan’s newly launched Alem Crypto Fund reportedly designated BNB as its inaugural national reserve asset, a move that provided a significant institutional legitimacy boost. Concurrently, the BNB Chain reported stellar Q3 growth, with decentralized exchange (DEX) volume skyrocketing by 185% to an impressive $37.1 billion. This growth was notably driven by protocols like Aster DEX, which alone generated over $29 million in daily fees, underscoring the network’s expanding utility and adoption.
The Parabolic Trajectory and Its Risks: A Retrospective Look
Observing BNB’s chart in late 2024, a powerful parabolic support line had been forming since mid-year. This kind of parabolic advance, while often leading to explosive gains, is inherently precarious, frequently culminating in equally sharp corrections. The Average Directional Index (ADX) at the time registered 33, well above the 25 threshold, signaling a strong trending market. This indicated that both institutional and retail investors were largely moving in sync, creating sustained buying pressure. However, ADX measures strength, not sustainability; a strong reading can persist right up until a trend exhausts and reverses, perhaps due to a significant whale dump or a sudden FUD (Fear, Uncertainty, Doubt) event.
Exponential Moving Averages (EMAs) presented a similarly bullish outlook, with the 50-day EMA providing dynamic support around $1,050-$1,070, and the 200-day EMA confirming a robust longer-term uptrend. This alignment, where shorter-term EMAs traded above longer-term ones, was seen as a strong bullish signal across various timeframes. Yet, the Relative Strength Index (RSI) painted a cautionary picture, sitting at 76 – firmly in the “overbought” zone. Readings above 70 typically signal a market ripe for profit-taking, and further strong moves could have pushed it past 80, historically triggering algorithmic sell orders. Traders with diamond hands knew this parabolic structure, while exhilarating, was fragile; a break below its rising support line could easily trigger a 20-30% correction as stop-losses activated and profit-takers flooded the exits.
BNB Price Prediction $2000: The Bullish Case That Was
The bullish scenario that captivated the market in late 2024 was straightforward: if BNB could maintain its parabolic support line through year-end, the chart suggested a clear path toward the $2,000 mark. This represented a potential 67% gain over a relatively short period, an ambitious but not entirely implausible target given the prevailing momentum. For this optimistic outcome to materialize, several key conditions were believed necessary:
- Continued expansion of the BNB Chain, driven by real-world applications that enhanced the token’s economic value, similar to the contributions of protocols like Aster.
- Increased institutional adoption, such as the move by Kazakhstan’s Alem Crypto Fund, to inject further liquidity and legitimacy.
- Bitcoin’s stability above $115,000, ideally pushing towards new all-time highs, as altcoins typically follow Bitcoin’s lead.
- A stable regulatory environment, free from major curveballs affecting Binance or the broader crypto ecosystem.
Under this optimistic projection, BNB was expected to first break above its then-recent high of $1,168, consolidate around $1,200, and then propel towards the $1,250-$1,300 range. This zone was seen as the crucial launching pad for further ascent to $1,500 and ultimately the coveted BNB price prediction $2000. Volume confirmation was deemed critical for each breakout, with light volume moves being flagged as potentially false signals.
Trend of BNB (BNB)
Navigating Market Volatility: Lessons from Past Forecasts
While the allure of a parabolic advance was strong, market analysts also considered a more cautious scenario. Parabolic moves, as exciting as they are, demand ever-increasing buying pressure to sustain their trajectory. Should this pressure falter, a sharp correction often ensues. With the RSI hovering at 76, a strong week could have pushed it past 80, a level historically associated with significant corrections. The parabolic structure itself was considered inherently fragile; even a brief dip below its rising support line could trigger a cascade of selling, leading to a 20-30% correction.
Such a correction, however, wouldn’t necessarily invalidate the long-term bullish trend, especially if prices remained above the 50-day EMA. Many traders would have viewed this as a healthy consolidation, allowing the token to shed overbought conditions and bring the RSI back to a more neutral 50-60 range. In this scenario, BNB might have traded sideways for weeks before attempting another leg higher, with a more conservative year-end target shifting to $900-$1,000. For those with a long-term view, the advice was often to HODL, while short-term traders considered scaling out profits or waiting for pullbacks before committing fresh capital. For a comprehensive view of market dynamics and potential future movements, tools like cryptoview.io can offer valuable insights. Find opportunities with CryptoView.io


