As we delve into the intriguing world of meme cryptocurrencies, one question seems to be on everyone’s lips: Can Bone ShibaSwap reach $2 again? This query is not without reason, given the recent performance of Bone ShibaSwap (BONE), the fourth-ranked meme coin by market capitalization, as per CoinMarketCap.
Current Market Dynamics of BONE
Having embarked on a remarkable rally since June, BONE has demonstrated a bullish trend on higher timeframe charts. However, a formidable resistance between $1.9-$2 has been observed. A dip below $1.6 could instigate a significant retracement on the lower timeframe charts.
Despite this resistance, further gains seem possible. Nevertheless, the sub-$2 resistance on higher timeframes could potentially dampen the bullish momentum.
Market Scenarios for BONE Traders
So, what should BONE traders be looking out for? One aspect that stands out is the fair value gap at $1.35, which could potentially lure BONE downwards. BONE has a history of returning to fill such gaps or imbalances created during a strong move.
The most recent gap, between $1.135-$1.375, is yet to be filled, while previous gaps from early July have been addressed. The $1.35 region coincides with the $1.4 resistance zone encountered by BONE in the first week of July, suggesting a potential buying opportunity if BONE were to move towards this area.
On-Chain Metrics and Market Trends
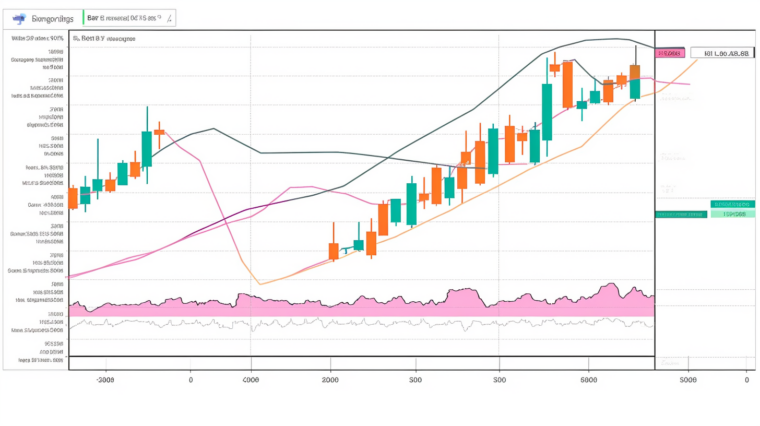
The market structure for BONE, at the time of writing, remains predominantly bullish on the 1-day chart. The Relative Strength Index (RSI) indicates strong bullish momentum, while the On-Balance Volume (OBV) has been on an upward trajectory since mid-June, reflecting the buying pressure that’s driving prices higher.
However, the bearish order block between $1.61-$2.1 on the weekly chart from February presents a resistance zone that BONE has already entered. A bearish structure break on the daily chart could signify the initial signs of rejection.
On-chain metrics reveal an accumulation of BONE across the network, hinting at potential price gains. Despite a sharp drop in July, the mean coin age has been trending upwards since April. However, the high MVRV ratio does raise concerns, suggesting that profit-taking activities could push prices lower in the coming weeks.
Want to know if your portfolio is in the green? One way to keep track of your investments and stay updated on market trends is by using applications like cryptoview.io. This platform offers a comprehensive view of your cryptocurrency investments and can be a valuable tool in your trading arsenal.
In conclusion, while BONE could potentially reach the $2 mark again, several factors, including higher timeframe resistance and the high MVRV ratio, could influence its trajectory. Traders are advised to keep a close eye on market trends and make informed decisions.


