Bitcoin whale transactions have surged to levels not seen in over half a year. The netflow of Bitcoin exchange indicates a lack of sell-offs. A recent spike in Bitcoin whale transactions has been observed alongside a dip in market prices. Could these transactions be a sign of a sell-off, or are they indicative of strategic accumulation by the whales?
Surge in Bitcoin Whale Transactions
Following a recent bout of price volatility for the leading cryptocurrency, transactions by Bitcoin whales have seen a significant uptick. An analysis of data from Santiment reveals that transactions exceeding $100,000 noticeably increased around the 4th and 5th of January. The data shows that the count of transactions in this category exceeded 34,000, a height not reached since June 2022. However, it is important to note that the transaction count has since dropped to around 9,400.
Sell-off or Accumulation?
The recent surge in Bitcoin whale transactions has sparked curiosity regarding the direction of the trade. One way to gain insight is by examining the flow of BTC on exchanges during and after the increase in transaction counts. An analysis of data from CryptoQuant shows a consistent negative trend over the past few days, except for the 4th of January, which saw a slight positive inflow of around 1,500. However, a closer examination reveals that the negative flow is relatively insignificant, suggesting a higher number of inflows. As it stands, the netflow is at -1,174. The data does not point towards a major sell-off from large addresses. Instead, there are signs of minor accumulations, suggesting that some traders are looking to capitalize on the slight dip in prices.
Bitcoin Volatility Experiences Minor Reductions
An examination of Bitcoin’s daily timeframe reveals an interesting trend: despite the ongoing decline, it has consistently remained above its short-moving average. This indicates that the overall trend is still positive. Furthermore, there have been minimal fluctuations over the last three days. At the time of writing, Bitcoin is trading at over $44,290, a less than 1% increase. An examination of Bitcoin’s Bollinger Band suggests a slight reduction in BTC volatility. The trend appears bullish, as indicated by the Relative Strength Index (RSI).
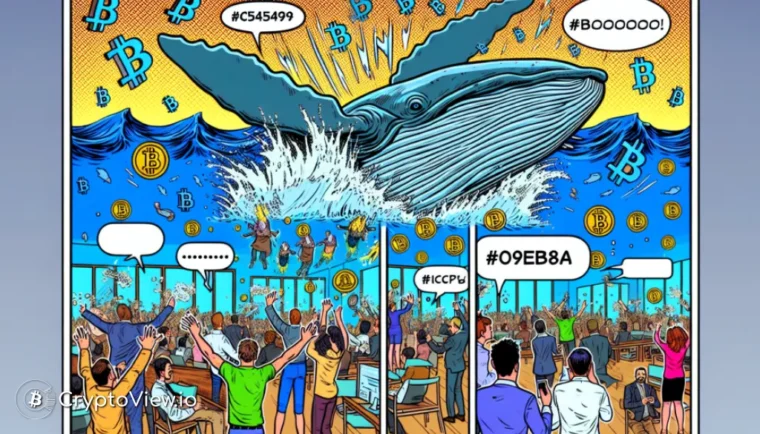
For those interested in tracking these Bitcoin whale transactions and other market trends, cryptoview.io offers a comprehensive and intuitive platform.
Discover More with Cryptoview.io

