After a period of steady growth, the Bitcoin price has hit a standstill. This has left investors and traders questioning whether this is a sign of an impending reversal or merely a temporary pause. This Bitcoin price analysis will delve into the technical details to shed light on the current market situation.
Insights from the Daily Chart
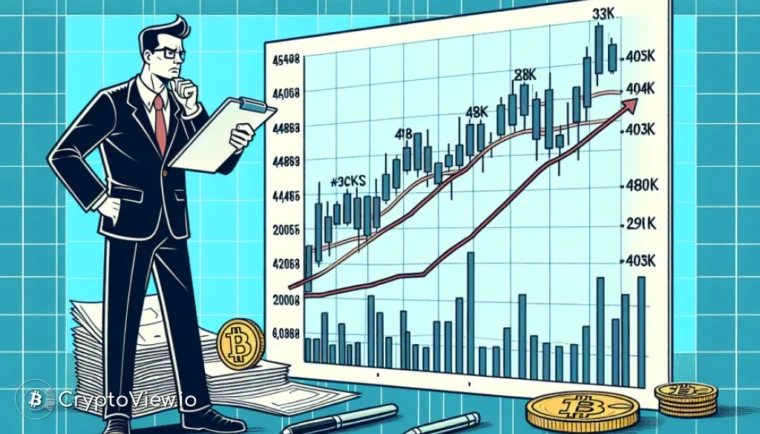
In the daily chart, Bitcoin has been steadily climbing, establishing higher peaks and troughs since its bounce back from the $20K mark in March. Several resistance levels have been surpassed, however, the $48K level remains elusive. Bitcoin is currently exhibiting a range-bound pattern. It is also significantly above the 200-day moving average, which is around the $32K mark. This suggests that a consolidation or even a correction could be on the horizon to allow the 200-day moving average to catch up.
A Closer Look at the 4-Hour Chart
The 4-hour chart provides a more detailed view of the recent price movements. The market has established two short-term resistance levels at the $45K and $43K price points and is currently trading below both. If Bitcoin fails to promptly rebound above the $43K mark, we could see a short-term dip towards the $40K zone. Given that the relative strength index is displaying values below 50%, the momentum seems to favor a bearish movement, making a decline more probable.
On-Chain Analysis: Short-Term Holder SOPR
Bitcoin’s price has been on an upward trajectory for the past few months, recovering from the bear market lows. However, market participants are curious if a correction is imminent. A look at investor behavior could provide some answers. The Short-Term Holder Spent Output Profit Ratio (SOPR) chart can be particularly insightful. This measures the ratio of profits or losses realized by short-term investors (those who hold for less than 155 days) when they sell their Bitcoin. A value above one indicates profit realization by short-term holders, while a value below one suggests losses.
Looking at the SOPR chart, it’s clear that with the recent price increase, the STH SOPR has risen above one. This indicates that these holders have been consistently making profits. While this could be seen as a positive sign, it could also be interpreted as bearish, as it could lead to an oversupply that could reverse the trend or at least trigger a correction.
For those interested in keeping a close eye on these market trends, the cryptoview.io application could be a useful tool. It offers detailed insights into cryptocurrency price movements, helping you make informed decisions.
Note: Always conduct your own research before making any investment decisions. Use the provided information at your own risk.


